From TV and radio signal covering long wave, medium wave and short wave to everyday cellphones and wifi hotspots that use GHz frequency range, RF signal is pretty much everywhere around us, just like air.
Although like air, radio signals can’t be seen by eyes, we can use instrument such as spectrum analyzer to visualize RF signals by their frequency and signal strength.
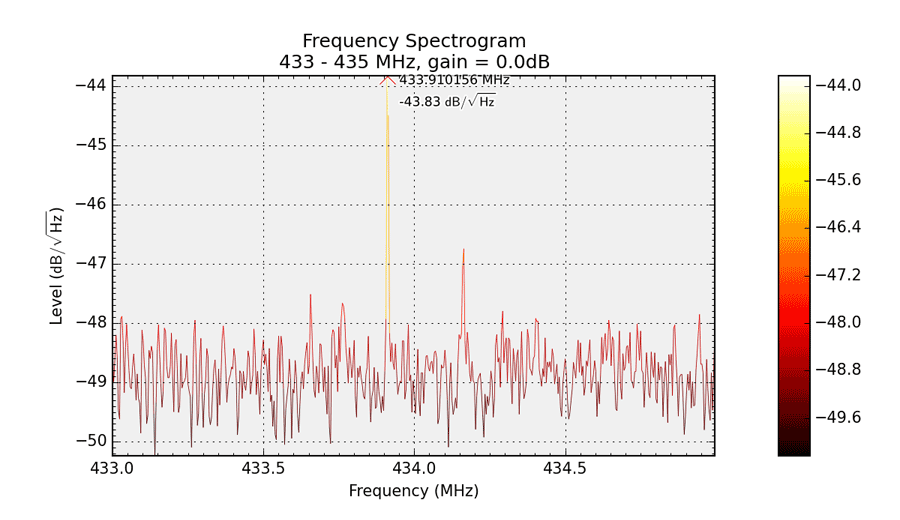
Original photo is taken on Aug 1st 2013 which shows radio signals measured and visualized using 500MHz band spectrum analyzer by ATTEN. Updated on May 10th 2016 using RTLSDR software on computer.
The center point frequency is adjusted to 433.92MHz – which is widely used around the world, especially in European countries such as United Kingdom and Germany due to law regulation. When we make RF remote control transmitters such as garage door and gate remotes, we normally choose the frequency range from 280MHz to 433MHz, and a higher 868MHz in Europe together with 915MHz frequency in USA is often used too, these are pretty much all ISM license-free frequency.
The X axis on spectrum analyzer represents frequency range, left is lower frequency while right side means higher frequency, as you can see the radio wave image has been cut off at certain spot on right side, as it is due to our equipment’s measuring range limit – 500MHz.
Frequency shows at X axis is also known as carrying wave frequency, which is not the actual encoded signal data rate or bit-rate, but the frequency where actual signal data resides on. A encoded signal can be at much lower frequency or bit rate, usually measured by bps or Kbps – not anywhere near the sub-GHz frequency usually used to carry transmitted signal, for example, typical rolling code HCS301 chip has bit rate of ~2.5Kbps.
The Y axis represents signal strength at certain frequency point, determined by X axis value – so X and Y together can measure signal strength at certain frequency point.
As you can see above, there are several spikes along whole frequency range, telling which frequency range has crowded traffic right now, and some spikes are very high in dimension as they are sources which have very powerful transmitting strength.
On the bottom of screen, there is a thick bed of signal spreading whole frequency range, which is generally considered as background noise, the noise always exists and doesn’t bother in most circumstances, but it will be strong enough to interfere existing signals when there is DC motor carrying heavy load around, we will have a seperate article on how to tackle with motor interference.